
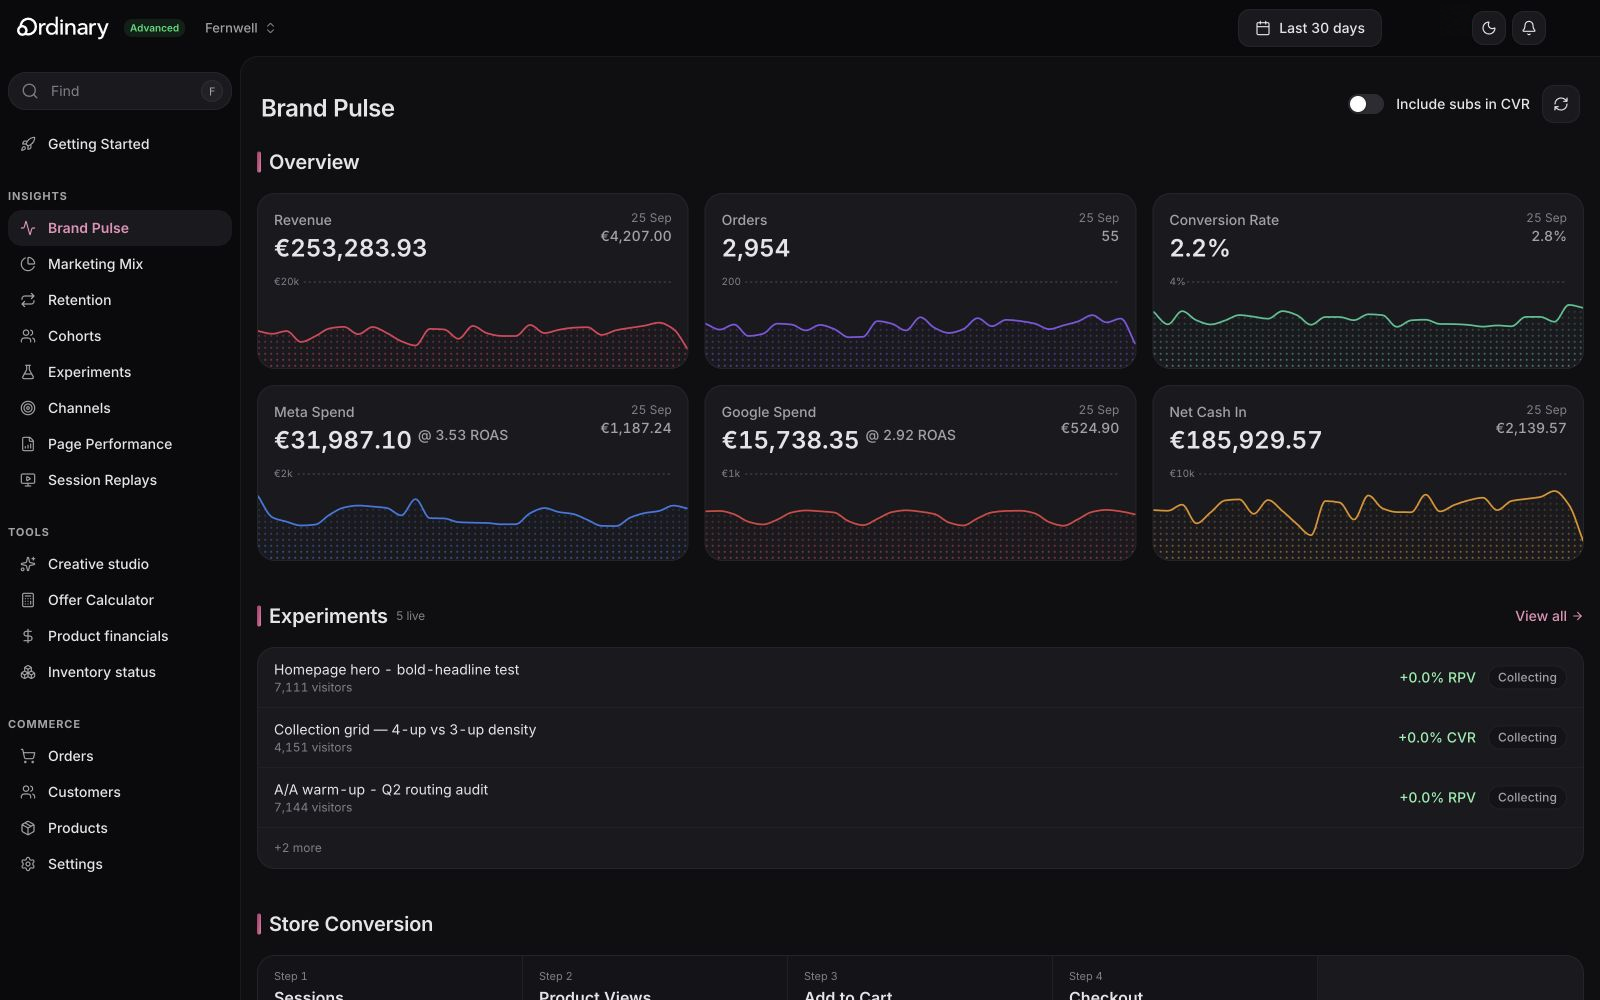





From the first click
to the next good decision.
Trace the order
Find the channels that earn their keep. Compare ad spend against real orders.
Find the friction
See where the shopping experience breaks down, then watch the session behind it.
Test the change
Measure the difference in conversion and revenue before making your next move.
Follow the next order
Understand what customers buy next. Keep the ones who haven’t returned in view.
Make the offer add up
Model costs, margins, and repeat buying before committing to a promotion.
Start with real numbers
Reconcile revenue with Shopify. Build your next decision on a number you trust.
Know which ads
earn their keep.
Different channels. The same yardstick. Connect ad spend to orders and compare performance with one attribution model.
Explore attribution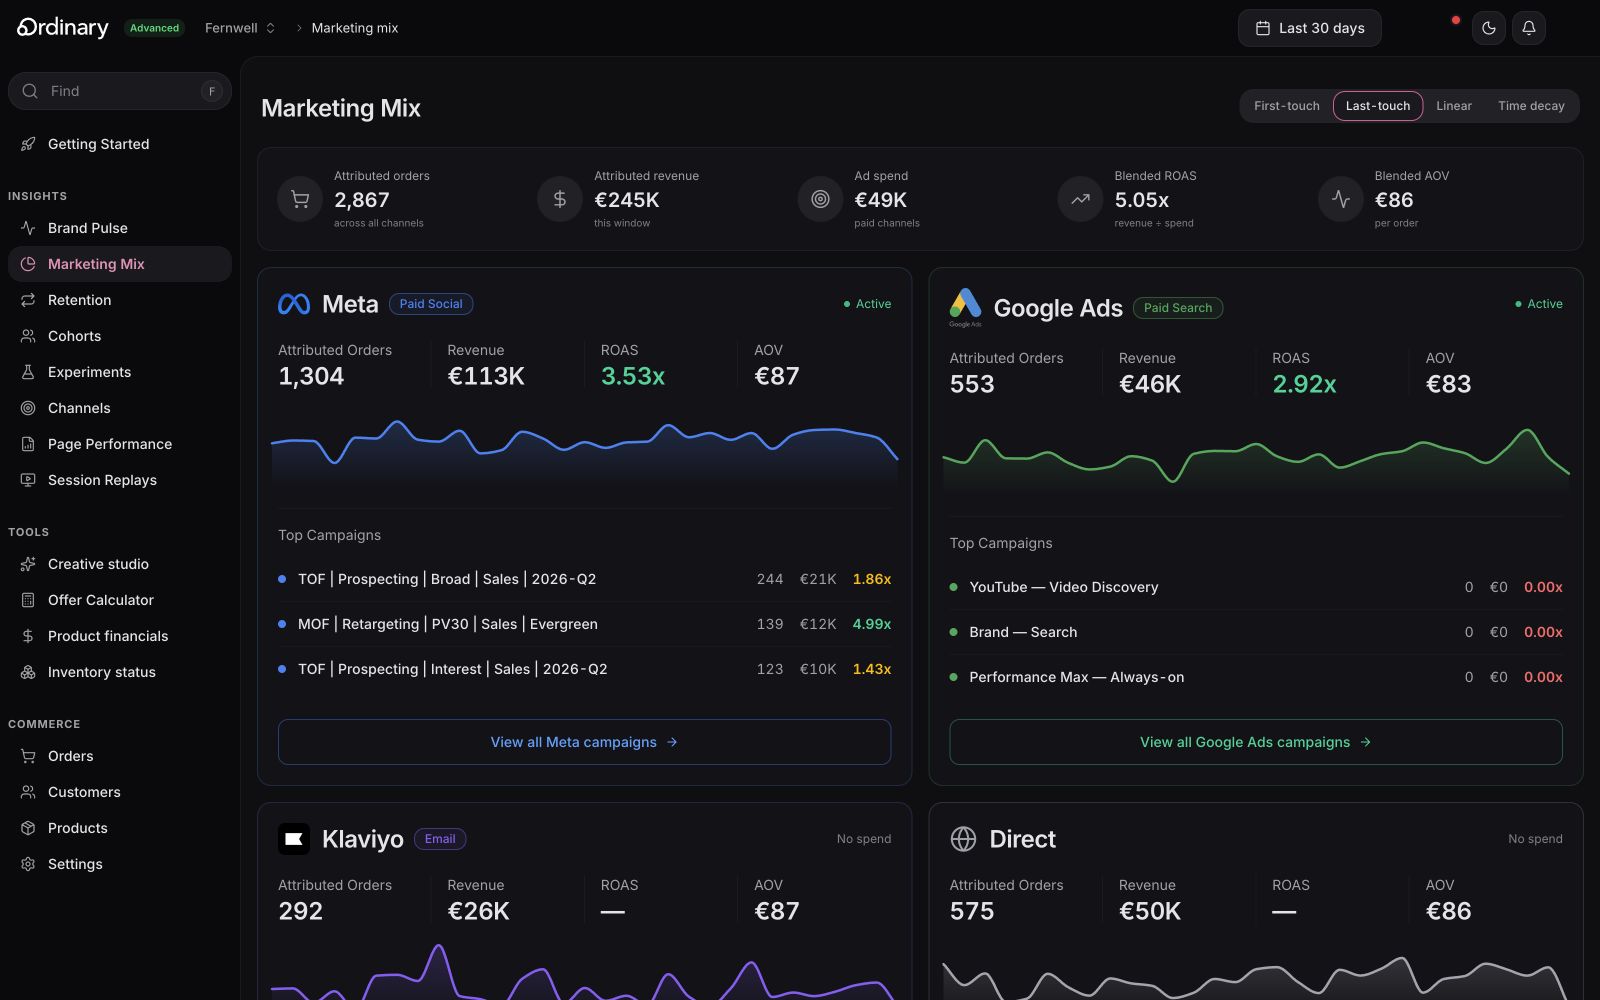
Follow the spend. See the orders and revenue behind each Meta campaign.
Compare like for like. Read Google Ads through the same attribution model.
Find the friction.
See the why.
An abandoned cart tells you what happened. A recording helps you understand why. Start with a signal, then watch the session behind it.
Swipe or scroll to exploreUse the left and right arrow keys when the screenshot is focused.
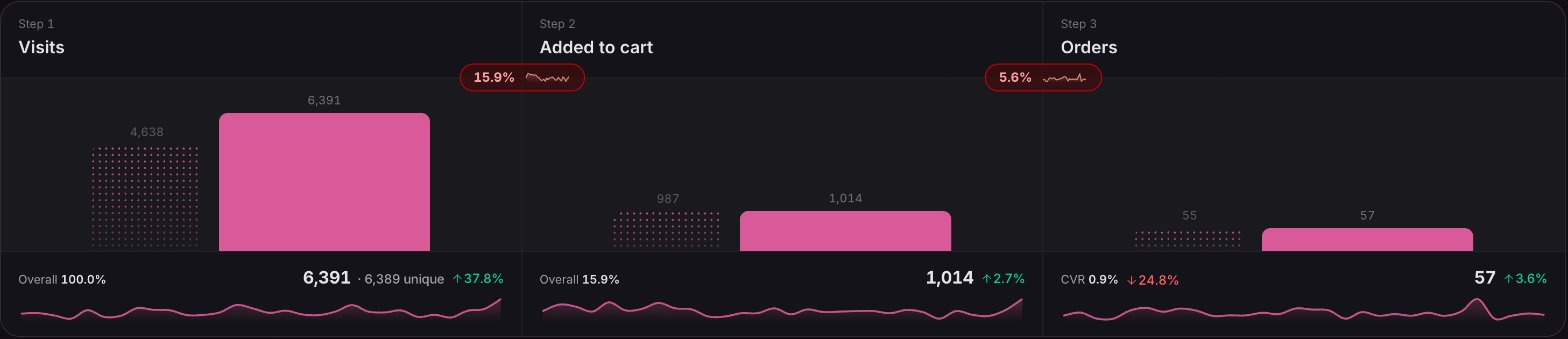
Find where the journey changes. Compare visits, cart additions, and orders for an individual page.
Full viewPut the numbers
in context.
A funnel shows you where to look. Recordings let you see the experience behind it, from the first interaction to the last click.
Explore session recordings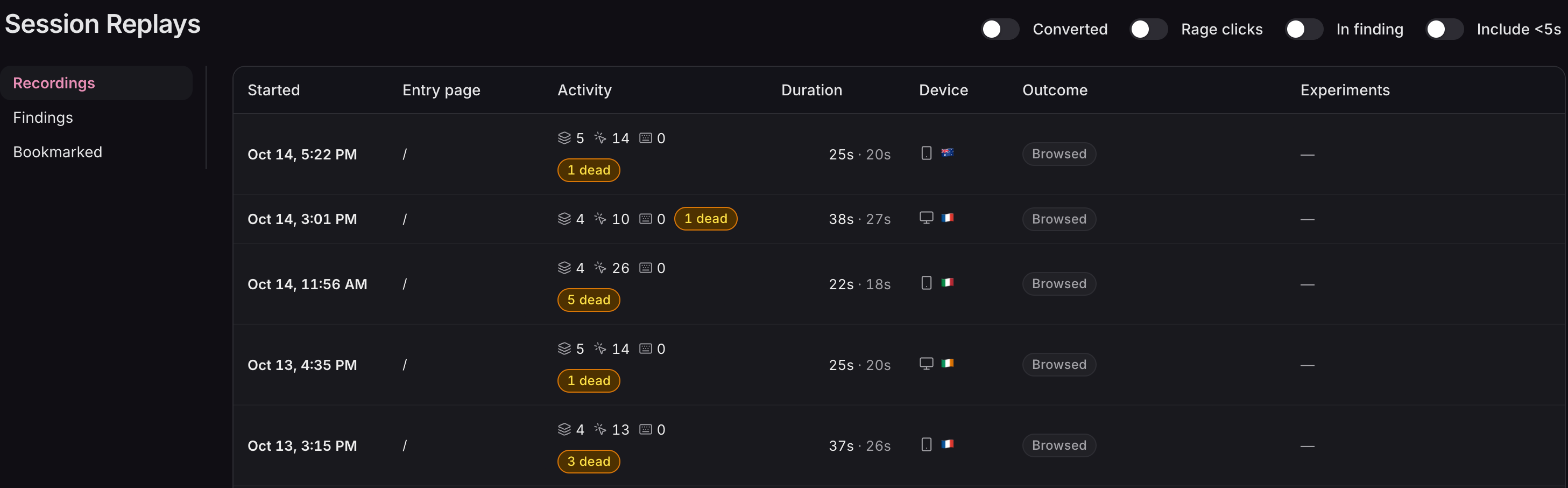
A place to start. Dead-click flags bring sessions worth a closer look to the surface.
Full viewA better idea?
Put it to the test.
Measure what a change actually does for conversion and revenue per visitor. Read the confidence behind the result before making the next move.
Explore A/B testing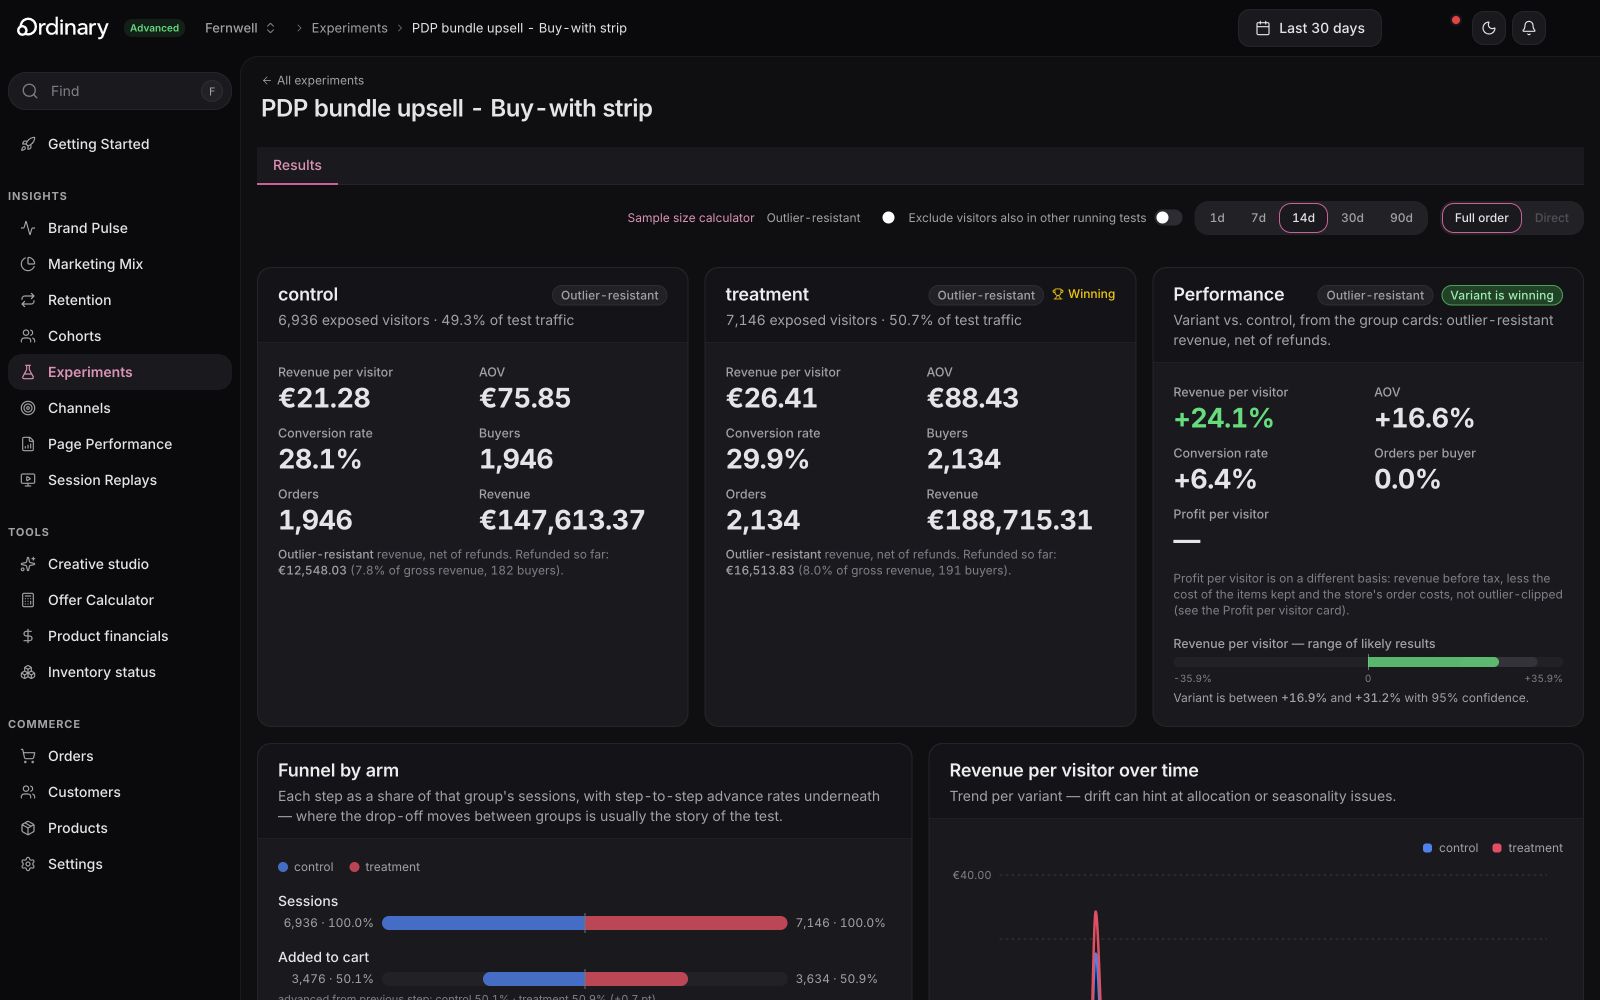
More than a headline lift. The range of likely results puts the difference in perspective.
Full viewCompare control and treatment
Control and treatment / Demo data
The first order is
only the beginning.
Follow customers from their first product to their next purchase. See who bought again, what they chose, and who hasn’t returned.
Explore retention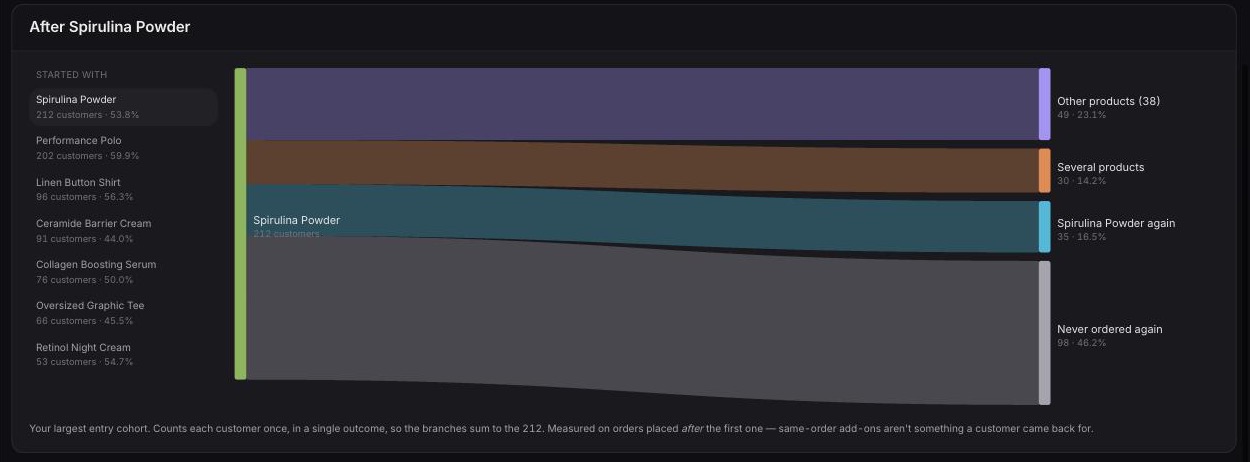
Swipe or scroll to exploreUse the left and right arrow keys when the screenshot is focused.
Every outcome stays in view. Including the customers who haven’t placed another order.
Full viewThe same product
Spot the products customers come back for.
Something different
See what they explore next in your range.
No next order
Keep the opportunity to bring them back visible.
An offer should
add up.
A discount changes more than the checkout total. Model acquisition cost, product cost, shipping, and repeat buying before committing to an offer.
Explore the Offer Calculator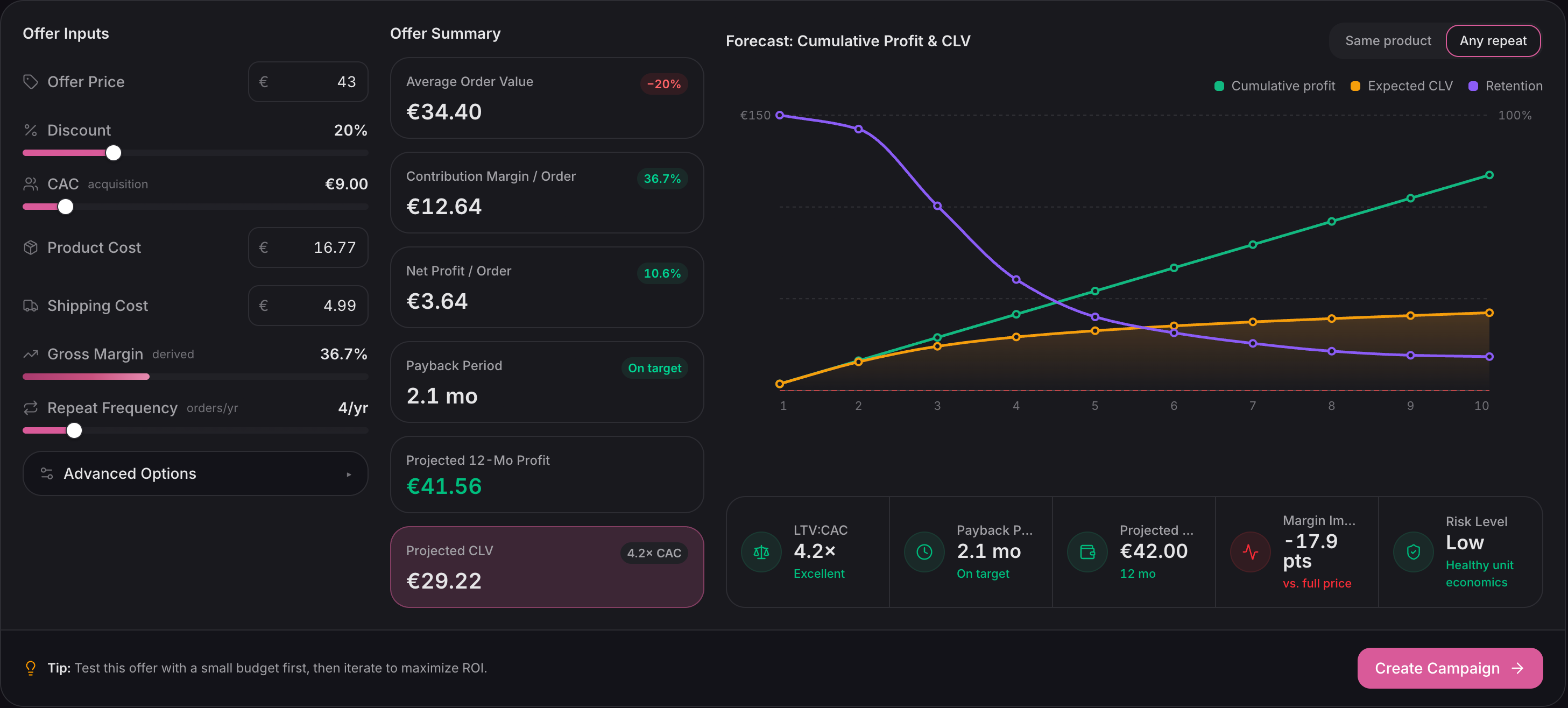
Swipe or scroll to exploreUse the left and right arrow keys when the screenshot is focused.
A model for the decision. Projected results depend on the inputs you choose.
- On the first order
- What’s left after the costs?
- Over time
- When could acquisition pay back?
- Before you decide
- How does another scenario compare?
Good decisions.
Real numbers.
Shopify says one thing. Your ad platforms say another. Start with a number you can actually trust.
How reconciliation worksTips, refunds, fees, discounts. Accounted for.
Illustrative figures.
What’s working?
Just ask
Claude or ChatGPT.
Ask what drove sales, which customers came back or how an A/B test performed. The answers come from your Ordinary reports.
Question: “Which gave us a better return last month, Meta or Google?”
Answer: Google came out ahead.
For every $1 spent, Google brought in $2.60 in Shopify sales and Meta brought in $1.90.
On Meta, retargeting returned $3.40, but the two prospecting campaigns returned less than $1.
Attributed return Revenue from paid Shopify orders credited to a channel, divided by ad spend on that channel.
 Start free
Available on all paid plans. View pricing
 Ordinary for Claude
 Ordinary for ChatGPT
- Store permissions
- Your assistant can read reports. It can’t change your store or your ad campaigns.
- Your stores only
- Your Ordinary sign-in determines which stores your assistant can read.
- Customer details
- Ordinary masks customer email addresses and phone numbers before sharing results.
of the dashboard.
We built Ordinary because
we needed it ourselves.
Make it an
informed one.
Free to start on any Shopify store.
Paid plans grow with your business.