
Overview
The Retention report puts a price on your repeat purchase rate: what one more point would be worth in revenue over a year. Size the opportunity, then decide how hard to chase it.
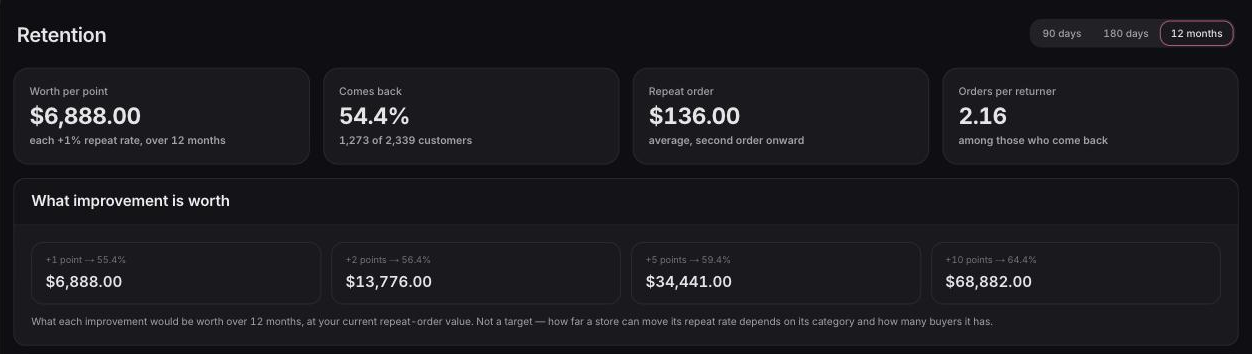
What you see
Where repeat customers are won and lost
Follow new customers from their first product
Start from the product a new customer bought first and see what they did next: bought it again, moved on to other products, or didn't come back.
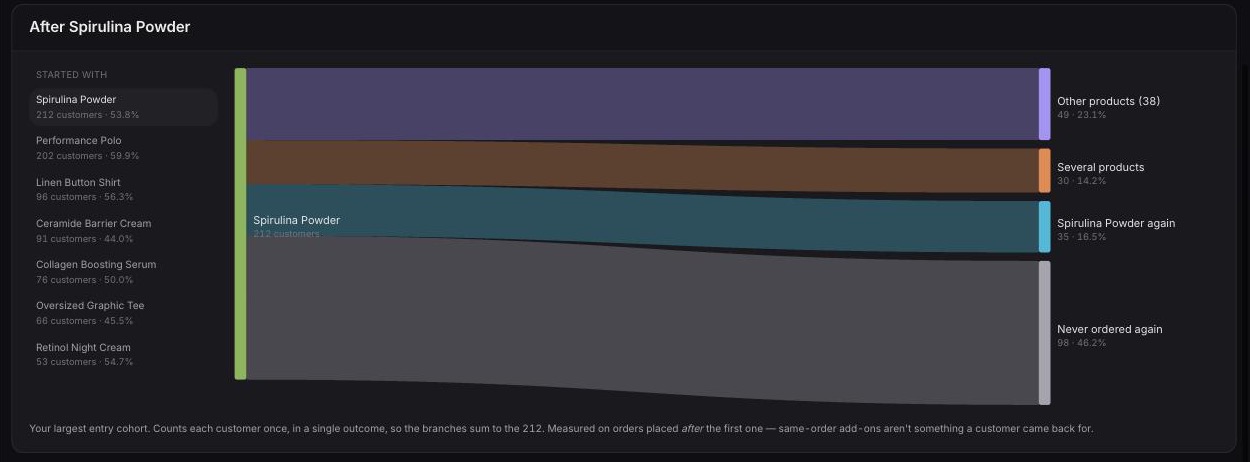
The customers who left are always in view
The group that didn't come back is always shown. It's usually the biggest opportunity on the page.
Switch the starting product in one click
Pick any product from the side list to redraw the flow. You might find customers who started on a starter kit went on to try more of the range.
Group size beside every rate
Every rate shows the number of customers behind it, so a striking rate from a handful of buyers isn't mistaken for a pattern.
Nothing to set up
The Retention report builds itself from your store's orders. Connect Shopify and it's there, with no tagging, no segments to define and no spreadsheet to maintain. The Retention guide explains each number on the page. If you want to go deeper on how each starting product's customers spend over time, pair it with cohorts by first product.
Available now
The Retention report is available on every Ordinary plan, including Free.
 Connect your store