
Overview
Open any page in Page Performance and see its landing page performance week by week, one channel at a time, with the ads that sent traffic inside each week. For what each page costs and earns, see what every landing page earns.
What you see
Every page, every channel, every week
A weekly table for every channel
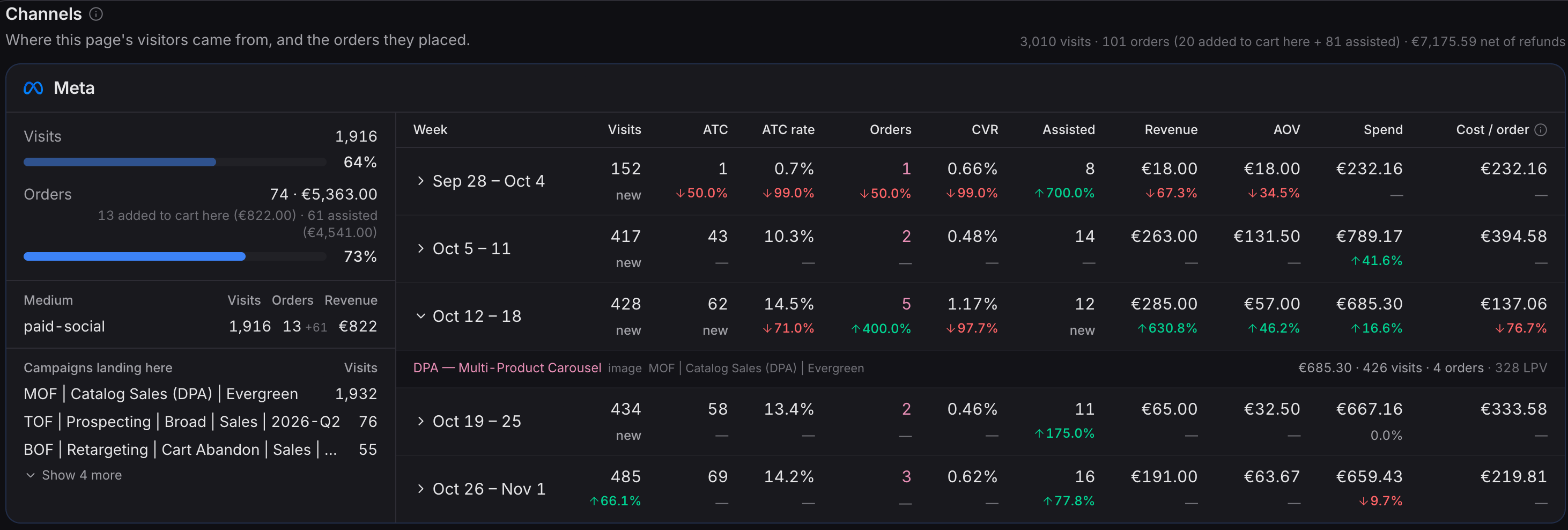
Each traffic channel gets its own week-by-week table: visits, adds to cart, orders, conversion rate, revenue and average order value. When one channel changes while the rest hold steady, you see it straight away.
Know when a page goes quiet
Click the bell on any page and we'll tell you, in Ordinary or by email, when its traffic drops well below normal. You choose how big a drop counts and how long it has to last.
The ads inside each week
Expand any week to see which ads sent traffic to the page, with the week's ad spend and cost per order, so you can see which ad changed. A week with ads running and no visits gets its own highlighted row.
Orders the page helped sell
Some pages rarely get an add to cart but still make sales happen: a comparison page, an ingredients explainer, a blog post. See the orders each page helped sell, so a page that does its job quietly still gets seen.
What the page's buyers purchased
One row per product the page's buyers ordered, with orders, units and net revenue, so you know when a page built for one product mostly sells another.
Available now
Weekly channel tables, the orders a page helped sell, what its buyers purchased and traffic alerts are live on every plan. Ad spend, cost per order and the ads inside each week are on the Starter plan and above.
 Connect your store