
Overview
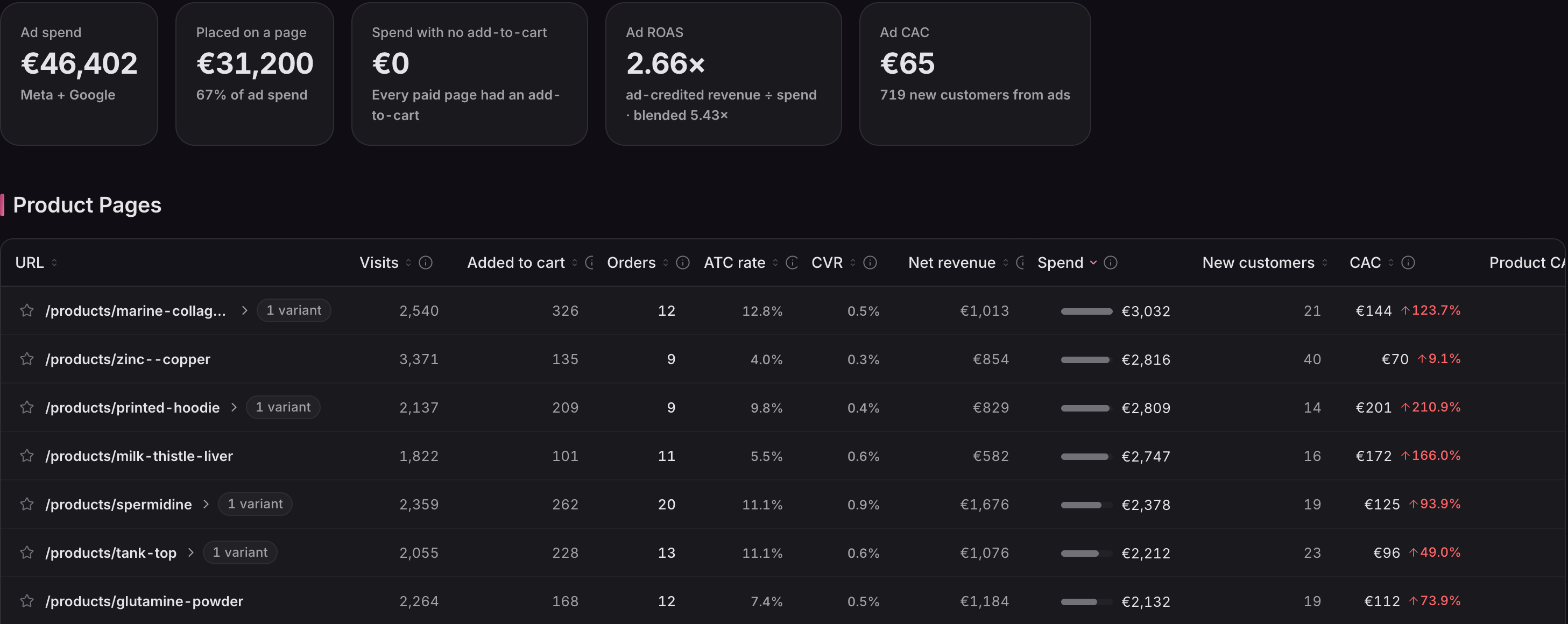
Your landing page analytics now carry the money: Page Performance puts every page's spend, net revenue, ROAS, new customers and CAC next to its funnel, so you can see which pages are worth what you send them. To follow one page week by week, see Page Performance over time; to compare the versions of one page, see landing-page angles.
What you see
What each page costs, and what it earns
Sort every page by what it costs and earns
Sort the list by spend, ROAS or CAC and compare pages without opening each one. A page your ads pay for is always listed and marked, even when nobody adds to cart from it.
Product CAC
Product CAC shows what it cost to win a customer for the product a page is built to sell. If your landing page for a hero product mostly wins customers who buy something else, Product CAC shows it.
Profit and payback, page by page
Open a page to see what its orders made after the cost of goods, because a strong ROAS can still lose money. Set each page's CAC against what a new customer is worth to your store after their first order, at 90 days and at 180 days, and see which one pays it back first.
Revenue on Page Performance is net of refunds: what your customers paid, less what you gave back.
Also in this release
Which page won, ad by ad
Experiment results include a By ad breakdown: for the people who clicked each ad, which page earned more.
Available now
Spend, net revenue, ROAS, new customers, CAC and Product CAC are live on the Starter plan and above. Profit and payback are on the Advanced plan; profit needs your product costs entered. The experiment By ad breakdown is on every plan.
 Connect your store