
Overview
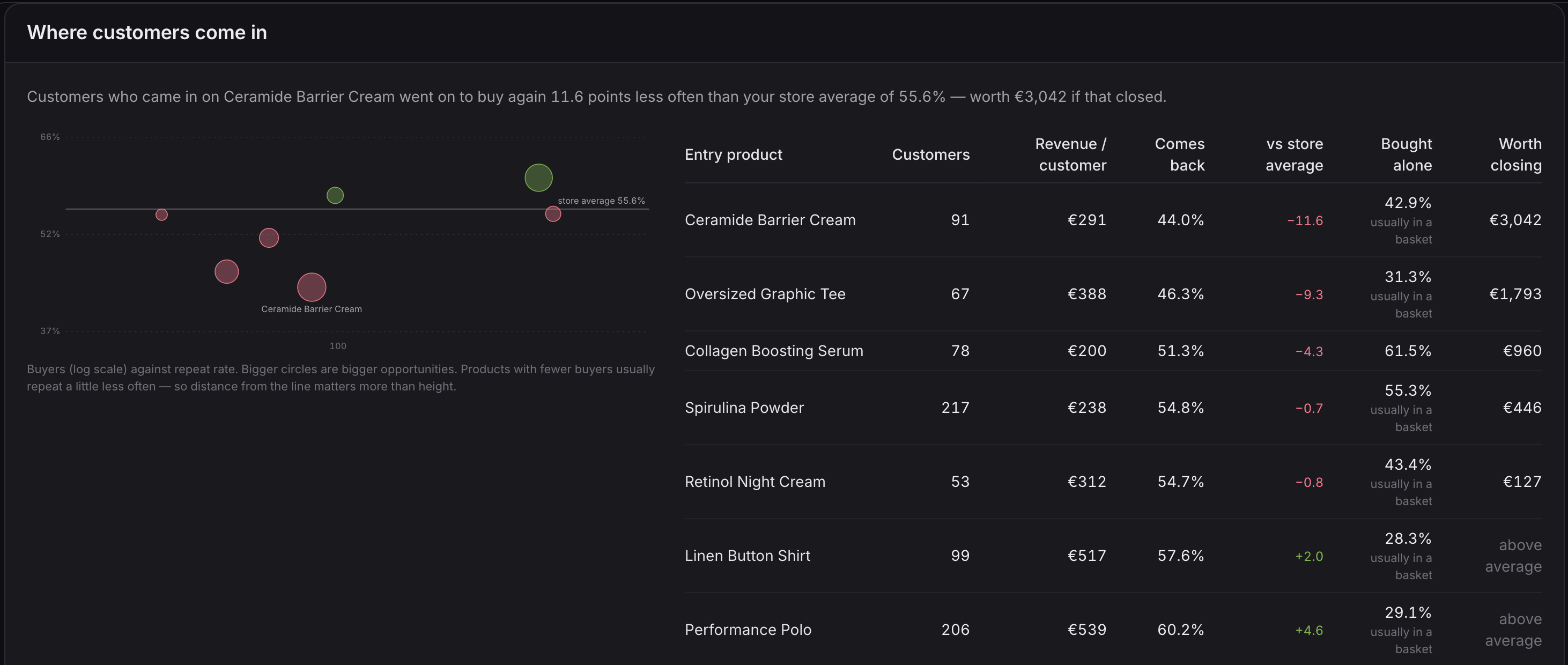
Group your customers by the first product they bought and see which one brings in people who keep spending. Lead your acquisition with that product, not just the one that wins the first order.
Customer cohort analysis
Which first product keeps customers
The Cohorts guide explains each way to group customers and what each number means.
Group customers by their first product
Alongside channel, country and U.S. state, group every customer by the first product they bought. Each product becomes its own cohort, side by side.
Compare what each group spends over time
A product with a smaller first order can still bring in customers worth far more months later. Groups too new to measure show a dash, so you never compare a few weeks against a full window.
See who comes back for a second order
Tell a one-and-done product apart from one that starts a habit.
Grouped by channel
Which channel's customers pay you back
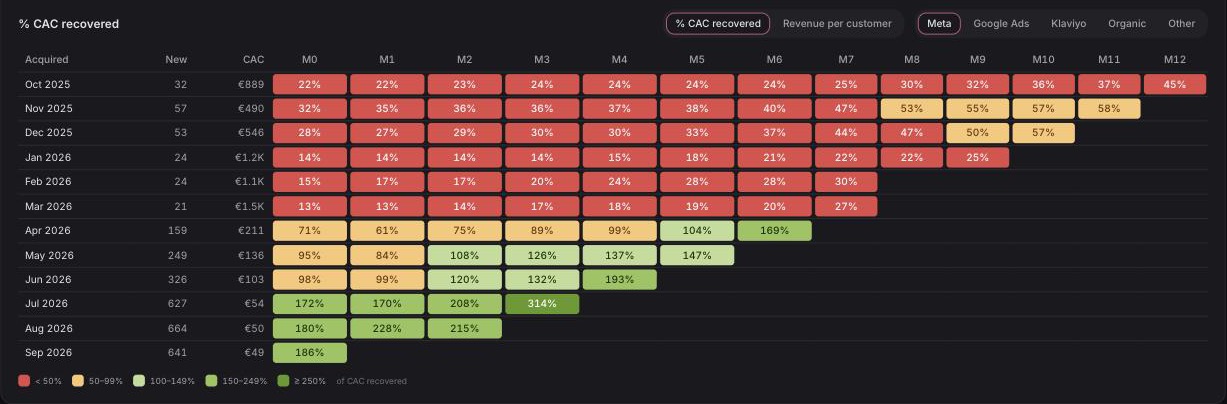
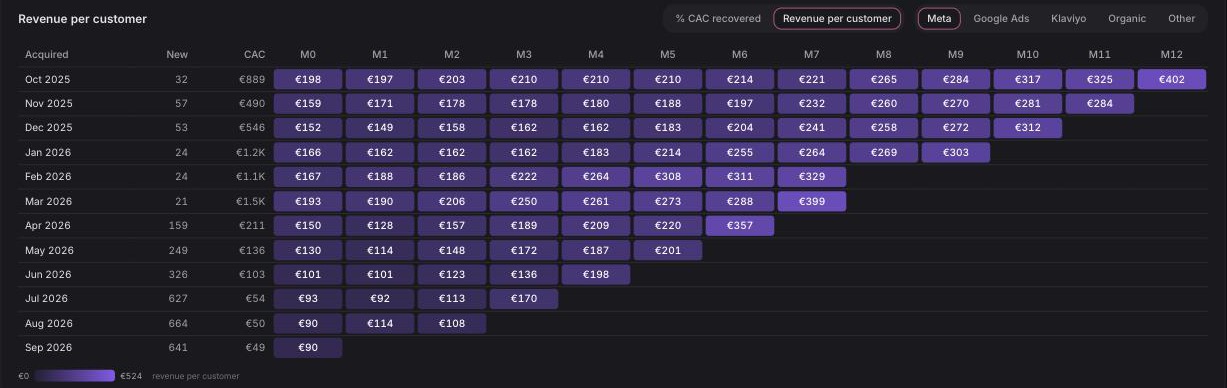
Grouped by channel, each row is a month of new customers. Each cell shows how they're doing up to twelve months later, so you see which channel's customers pay for themselves, and how fast.
Acquisition cost earned back
How much of what you paid to acquire them they've already earned back: your CAC payback period, month by month.
Don't know your acquisition cost yet? Start with the CAC calculator
Spend per customer
How much each customer has spent so far, for every month of new customers as they age.
Every breakdown is saved in the page link, so a teammate or your agency opens the exact view you're looking at.
Available now
Cohorts, including the first-product breakdown, is available on the Advanced plan.
 Connect your store