
The first order is only the beginning.
Follow the customers Google brings to your Shopify store. See how much they spend over time, how quickly they recover acquisition cost, and whether newer cohorts are improving.
Cohorts is available on Advanced and higher. Connect Google Ads to include acquisition spend.
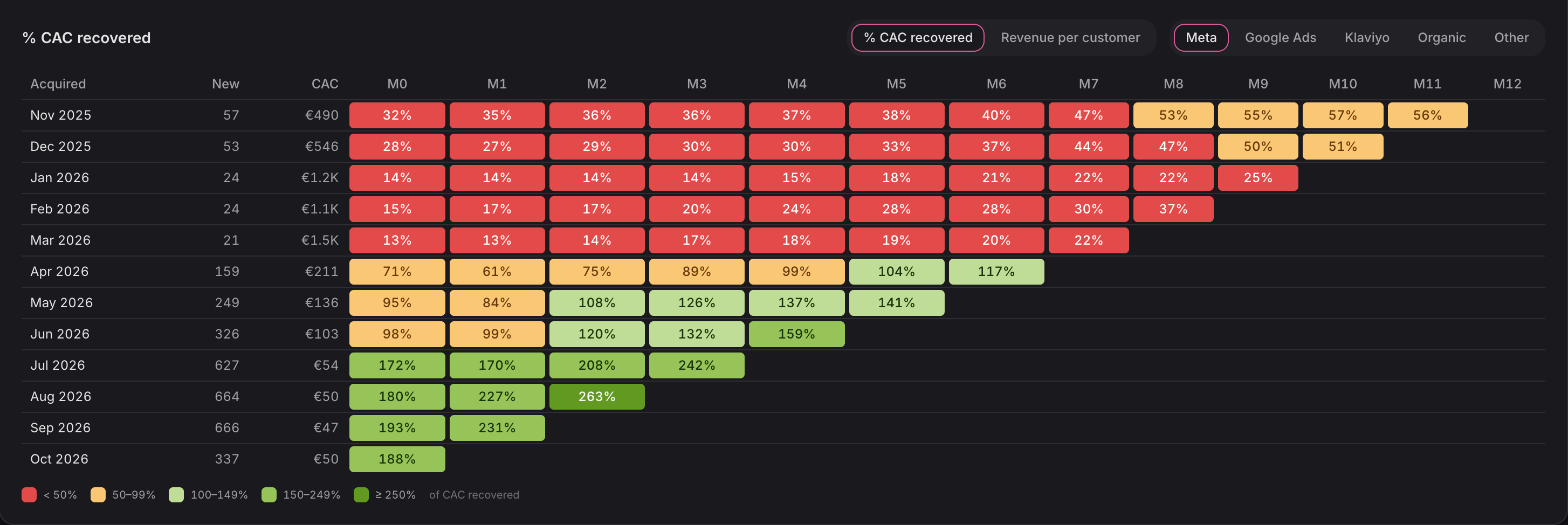
The Cohorts interface, shown with Meta selected. Choose Google Ads to follow your Google-acquired customers in the same view.
Full viewSwipe or scroll to explore. Use arrow keys when focused.
01 / Read the payback
A month to acquire.
Months to understand.
Choose Google Ads in the monthly cohort grid. Each row follows the customers acquired in one month; the columns show what those customers brought back as they aged.
- Read across
Watch value build
Follow a cohort from its first orders into the months that come after.
- Read down
Compare at the same age
See whether newer groups generate more value by the same point in their customer journey.
- Switch the measure
Choose the question
See revenue per customer, or the percentage of acquisition cost recovered when spend is available.
100% CAC recovered means customer revenue has matched acquisition spend. It is a revenue payback measure; product, fulfilment and other costs still matter to profit.
02 / Customer value
Separate the first sale
from the relationship.
The tables below the grid separate new-customer acquisition, returning-customer revenue and value at fixed ages. Together they show more than a single period's ROAS.
| View | What to look for | The question |
|---|---|---|
| New customer acquisition | Customers, first-order revenue, CAC and acquisition ROAS | What did it cost to earn new customers? |
| Returning customer revenue | Orders from earlier customers, grouped by their acquisition channel | What are previous cohorts contributing now? |
| Lifetime value | Cumulative revenue at 30, 60, 90 and 180 days | How does value develop after acquisition? |
| Behaviour | First and repeat order values, plus repeat-purchase rates | How does the customer relationship change? |
03 / Compare fairly
Give every cohort
time to become itself.
A customer acquired last week cannot have a six-month history. Recent rows stay shorter, and lifetime-value measures only include customers who have reached the age being measured.
A blank cell means “not old enough yet.” It does not mean zero value.
Revenue also reflects sales returns. A refund can reduce a later value, so a cohort's curve does not have to rise at every point.
These Google cohort views group customers by acquisition channel. For individual campaign performance, open Google Ads under Channels.
Explore Google campaign reportingWhich plan includes Cohorts?
Cohorts is available on Advanced and higher. Connect your Shopify store for order history and Google Ads for the spend used in acquisition-cost reporting.
Is this a prediction of future revenue?
The monthly grid and fixed-age LTV tables show observed customer revenue. Later ages remain empty until the customers have reached them.
Can I compare individual Google campaigns here?
Cohorts groups Google acquisition at channel level. Use Google campaign reports for campaign and ad-group performance; use Cohorts for what the acquired customers become worth over time.
What else can I group customers by?
Alongside acquisition channel, explore country, US state, first product and first-order value. Available cost measures depend on whether spend can be associated with that grouping.
See what your acquired customers become worth.
Bring Google Ads and Shopify together, then follow customer value beyond the first purchase.
Connect your store